Curriculum
Growing Your Business On YouTube
Measuring What Matters on YouTube
There are a ton of KPIs you can look at for YouTube, but like everything its understanding what matters to save you from drowning in the sea of analytics.
How to find YouTube analytics on desktop
Step 1. Log in to your YouTube account and click on your profile icon in the top right corner.
Step 2. Select YouTube Studio.
Step 3. You will have basic YouTube marketing analytics on your dashboard and an option to see more in-depth analytics in the menu on the left of your screen. Click on the analytics icon on the menu.
Step 4. You can access an overview of your analytics here or dive into areas like content, audience, and research.
Step 5. Select Advanced Mode in the upper right corner. This gives you a detailed breakdown of your YouTube channel metrics, metrics for individual videos, and sophisticated analytics.
Essential YouTube analytics metrics and reports
In this lesson you will understand the essential YouTube analytics metrics and reports by the primary tabs on your dashboard:
- Overview
- Content
- Audience
Research is more of a proactive tab that can influence your reports and metrics. Revenue only pertains to those in the YouTube Partner Program.
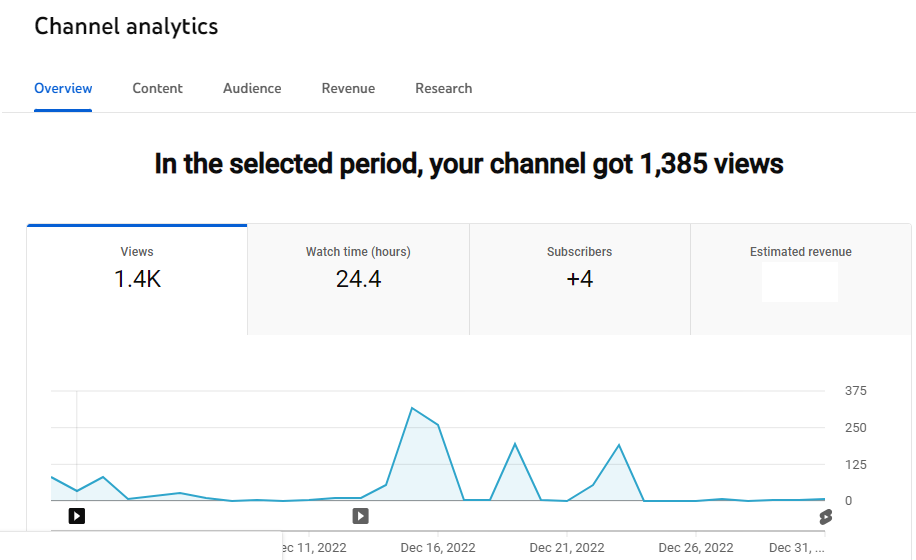
Overview
Your Overview tab shows YouTube metrics like the amount of views overall, watch time, subscribers, and estimated revenue, if you’re a part of the YouTube Partner Program. You may see a report that shows a comparison of performances.
In the Overview tab, you will see:
Typical performance: This shows your channel’s typical performance at either the channel or video level. This gives you a snapshot of how your channel or videos are performing.
Realtime: Realtime gives you a performance report for the last 48 hours or 60 minutes. If you’ve just launched a video, you can see how it’s performing or affecting your overall channel performance. You can also find out when your YouTube channel views peak, giving you insight into your best time to post.
Stories: Stories gives you a performance report from your latest Stories.
Top remixed: This is the amount of your content remixed or used in Shorts and the number of remix views. Remixes are great since they include tags that credit your content and drive traffic back to your channel. Remixes can help to improve your channel visibility and video views.
Your top content in this period: This ranked list shows you exactly what’s working and what’s not. If you adjust the date range to your channel’s lifetime, you can see your all-time best-performing videos.
Content
Your Content tab will show you metrics like views, impressions, impression click-through rates, and average view duration. In this tab, you can view this information broken down by content types, like all content, videos, Shorts, and posts.
This tab gives you an idea of how your content is performing, allowing you to adjust or improve your strategy.
In the Content tab, you will see:
Views: This metric shows you the number of views your content has received. This is helpful to know where your content stands overall.
Impressions: This is how many times your thumbnail was shown to viewers. If this is low, you may want to re-think your YouTube SEO strategy and look at YouTube’s algorithm again.
Impression click-through rate: This is how often your thumbnail results in a click. If your impressions are high but this number is low, you may want to reconsider your thumbnail content and design.
Average view duration: This is how long viewers watched your content. If this is low, but everything else seems to be high, you may have an issue engaging your viewers.
Key moments for audience retention: This metric shows you which moments grabbed your audiences’ attention. If you have issues with your average view duration, review this to see what is working.
How viewers found your content: This can be helpful to see where your viewers are coming from. Then, you can double down on efforts within these journeys or re-think your strategy to get viewers from other channels.
Subscribers: This shows you the subscribers who came from each of your content types. This can help you know whether your videos, Shorts, live streams, or posts gain the most loyal viewers.
Top videos/Shorts/posts: Your most popular videos, Shorts, and posts. This shows you what’s working well, so you can rinse and repeat.
Top remixed: Your most popular remix views, total remixes, and top remixed content. This shows you what’s working for your remixes or which content pieces people are remixing. Double down on the videos that are working for you here.
Post impressions: Much like Impressions above, this is how often your post was shown to people. You can use the same strategy here.
Audience
Your Audience tab tells you all about your viewers. This includes returning or new viewers, unique viewers, subscribers, and total members.
You’ll see demographic information, including subtitle language, so you can customise your content to who they are. It also shows you when your viewers are on YouTube so you can tailor your publishing schedule to meet them when they’re on the app.
Pro tip: Keep an eye on what your subscribers are doing — they’ll watch and engage with more of your content than any other viewer type. When you gain more YouTube subscribers the right way, your organic marketing efforts will bloom.
In the Audience tab, you will find:
Videos growing your audience: This data shows you which videos are actively growing your audience. This helps you to know what new viewers are looking for. Pay attention to metrics like new viewers or returning viewers here.
When your viewers are on YouTube: This report tells you when people are online and watching. Use it to base your publishing schedule on and to plan when to do a live stream. Is your audience online when you’re not? Don’t worry; you can schedule your YouTube videos with Buffer or Canva.
Content your audience watches: Find out what your audience is watching when they’re not on your channel. Use this report to find inspiration for your own channel, collaboration opportunities, or ideas for your thumbnails.
Channels your audience watches: Much like the above content your audience watches, this report shows you the channels your audience is interested in. The same strategy as above applies here.
Top geographies: This shows you where your viewers are watching from, which can give you insight into how to tailor your channel to them.
Age and gender: This shows you the age and gender your audience identifies with. Like top geographies, the more you know who your audience is, the more you can tailor your content to them.
Top subtitle/cc languages: This shows you which languages your audience is watching subtitles in and, again, offers an opportunity to customise your content.