Curriculum
Content Posting
Fail to Plan – Plan To Fail
0/3Scheduling Tools
0/4Content Engagement
0/3Insights & Analytics
0/1Scheduling Tool Analytics
What gets measured gets managed. Just like your financials you need to know what is giving you a decent ROI and what is simply wasting your time. Which is why if you are using a scheduling tool or even spending time on Social Media you need understand the analytics.
What is social media analytics?
Data keeps you on track to achieve your social media goals, proving what’s working and — just as importantly — what’s not. Social media analytics is the collection and analysis of data to help you measure the performance of your social media accounts.
To track social media analytics, you’ll look at likes, comments, shares and saves, but you might also monitor mentions and discussion of your brand or consumer insights by practising social listening.
Decide which metrics matter to you most
There are a lot of different numbers flying around the social-media-verse. Likes! Followers! Views! Shares! How do you know which of these social media metrics are important?
Social media metrics fall into one of four categories:
1. Awareness: current and potential audience.
2. Engagement: how audiences are interacting with your content.
3. Conversion: effectiveness of your social engagement.
4. Consumer: how active customers think and feel about your brand.
If your goal is to grow your Instagram following, then metrics that track engagement (like follows and likes) are probably the most important ones to keep an eye on. If your goal is sales, conversion-related metrics are more relevant (that might include views or click-through rates).
Check in regularly
Importantly, social media analytics shouldn’t just be used for “before and after” snapshots of your goal’s impact. Check in regularly on your analytics over the course of a campaign or project with social media reports to ensure you’re on the right track.
Meta Business Suite
Meta Business Suite is Facebook Analytics where, you can see metrics, trends, and visual reports to help you gain insights about your overall Facebook account or individual posts.
Here’s how to find your Facebook Analytics in Meta Business Suite:
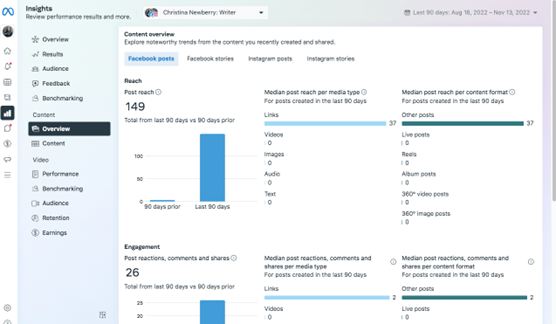
- Open Meta Business Suite and click on Insights. On the overview screen, you’ll see top-level insights for Facebook on the left of the screen and Instagram on the right.
- Click on any of the categories in the left menu to get more details of your Instagram and Facebook metrics.
- To look specifically at Facebook content metrics with no Instagram data to distract you, click on Content in the left menu under the Content heading. Then, open the Ads, Posts, and Stories drop-down menu and uncheck the Instagram options.
Analytics you can track:
- Reach: This includes people who saw content posted on your Page as well as people who saw content posted about your Page by other social users.
- Visits: The number of times people visited your Facebook Page.
- New likes: The number of new people who liked your Facebook Page.
- Follower growth rate: How quickly your Page is gaining or losing followers.
- Virality rate: The percentage of times content from your Page was displayed as a result of reactions, comments, and shares (available in Hootsuite Analytics).
Facebook audience insights
- Age & Gender: The breakdown of age groups and percentage of women and men (no statistics for non-binary folx at this time, unfortunately).
- Location: You’ll see the top cities and countries for your audience, so you can understand just where the likes and followers are coming from.
Facebook post analytics
- Post reach: The Content Overview screen indicates the number of people who saw at least one of your posts at least once. This is an overall metric, but you can also dive into the reach numbers for each specific post by clicking on the Content item under the Content heading. While the overall metric provides a good sense of trends in your post viewership, the per-post metrics are more useful in terms of understanding what’s actually resonating with your audience.
- Post engagement: The number of reactions, comments, and shares. Again, you can see both the total number for all Page posts and the details for each specific post. For reference, the average Facebook post engagement rate is 0.07%.
Buffer Analytics:
Buffer gives you one dashboard for your all your social media analytics and reporting which means you can track performance and create reports for Instagram, Facebook, Twitter, and LinkedIn — all from one intuitive analytics dashboard. Some examples of data tracked include number of likes, comments, engagement rate, follower growth, and daily average clicks, just to name a few important ones.
- Their tool gives personalised recommendations to increase your reach and engagement, so you can save more time analysing your data and focus on creating great content
- You can get a detailed breakdown of all your social media posts, including boosted Facebook and Instagram posts, and learn which posts have resonated with your audience (highest engagement rate) and which have spread far and wide (highest reach);
- You can get an aggregate view of all your social media channels’ performance in one single dashboard, instead of checking separate social apps multiple times a day;
- You can get in-depth insights on when, what, and how often to post to grow your engagement rate and following;
- You can create reports of your results every week or month to regularly show the value you are bringing to the business.
Using Canva Analytics
Canva while Canva simplifies life by letting you schedule or post directly after designing there is unfortunately no actual reporting or valuable insights. If you click on the actual post in the planner it will give you reach insights but no actual best time based on your audience.
Next Lesson: Paid Ads & Facebook Posts